Money slips away and it is unclear where.
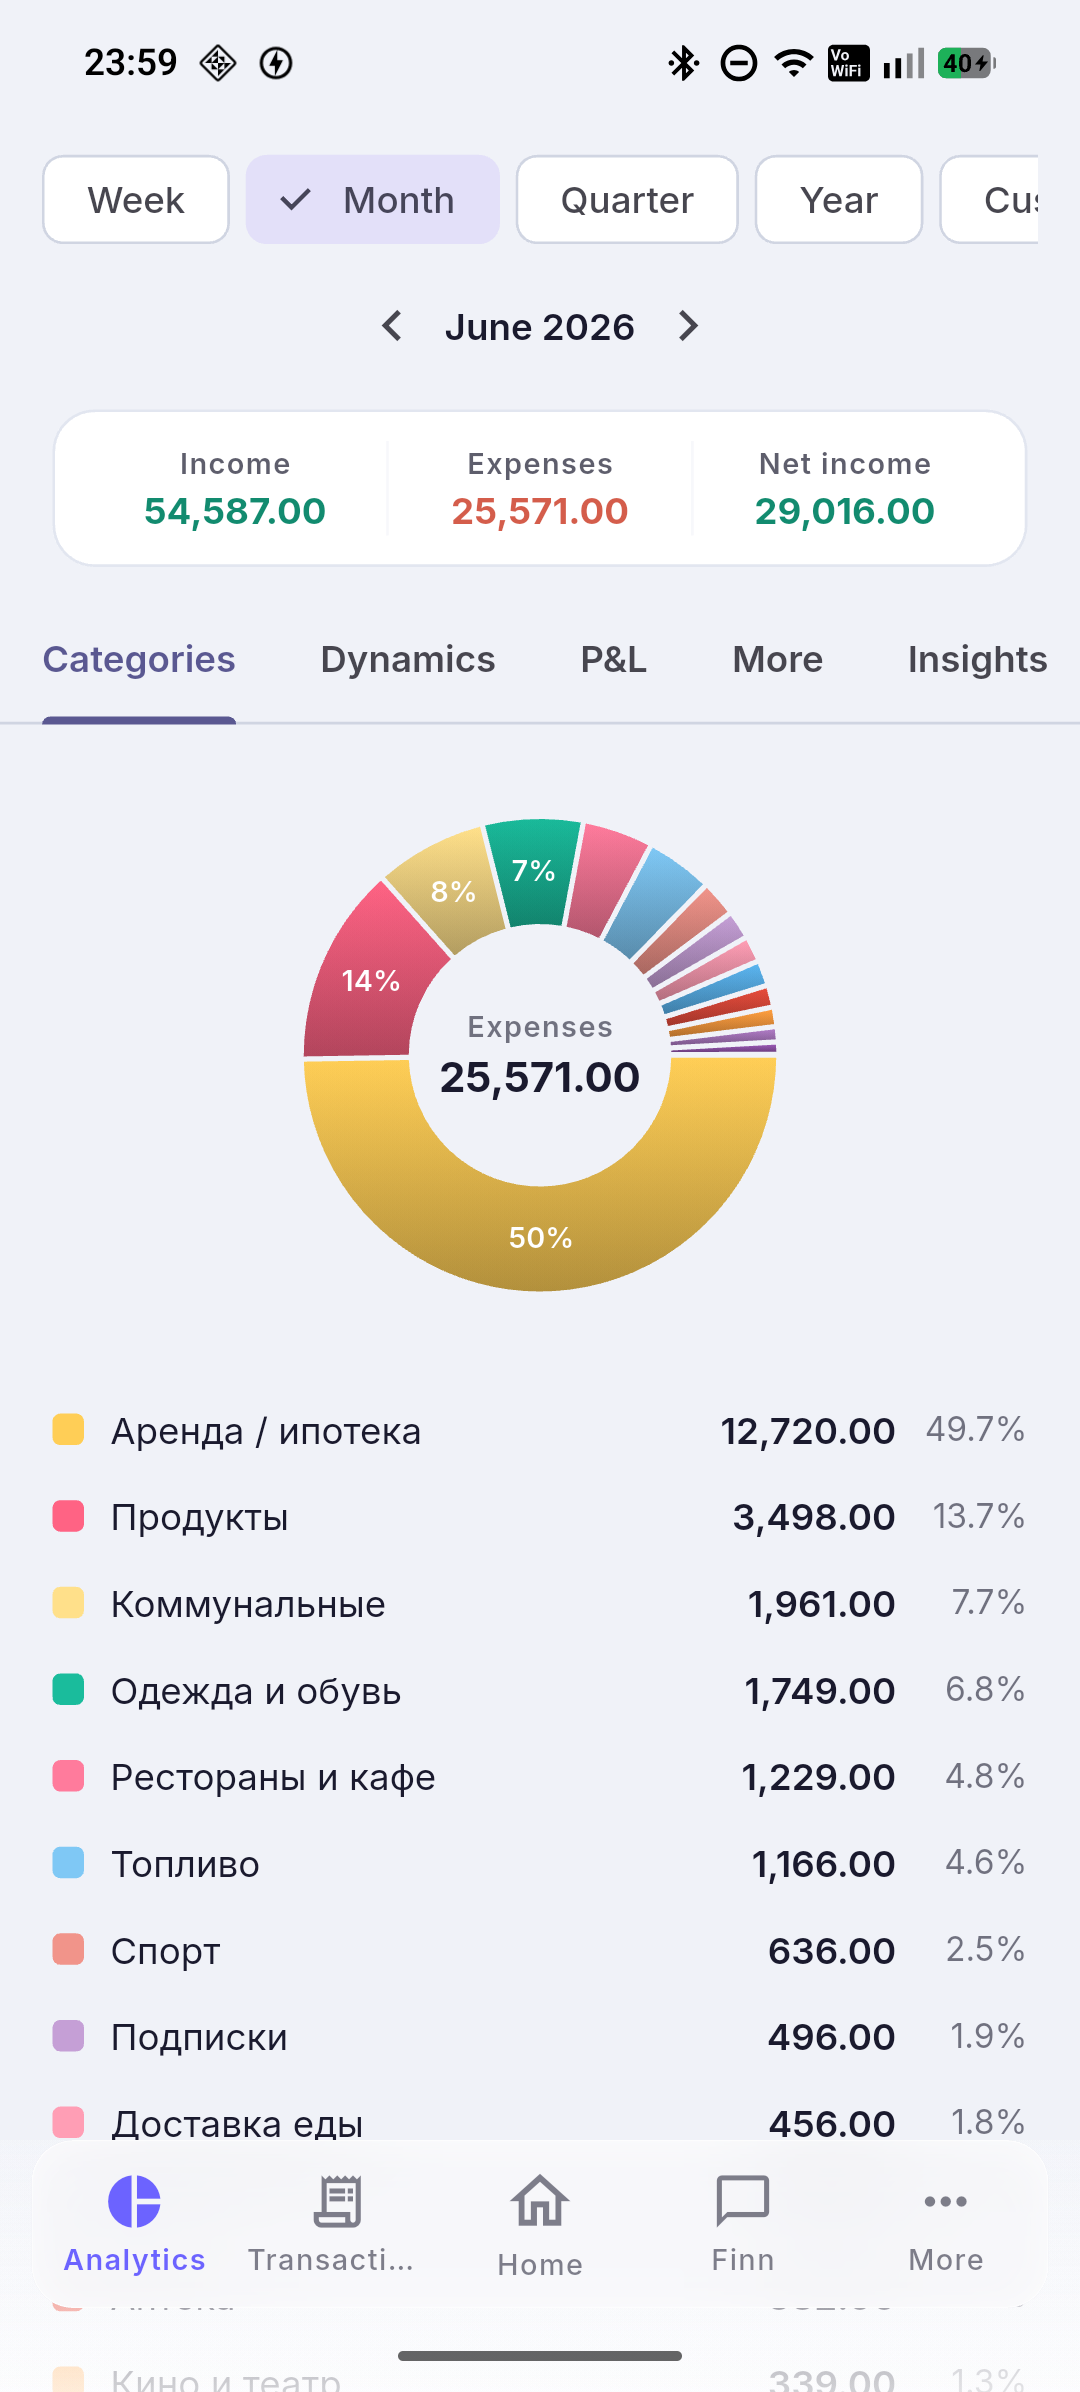
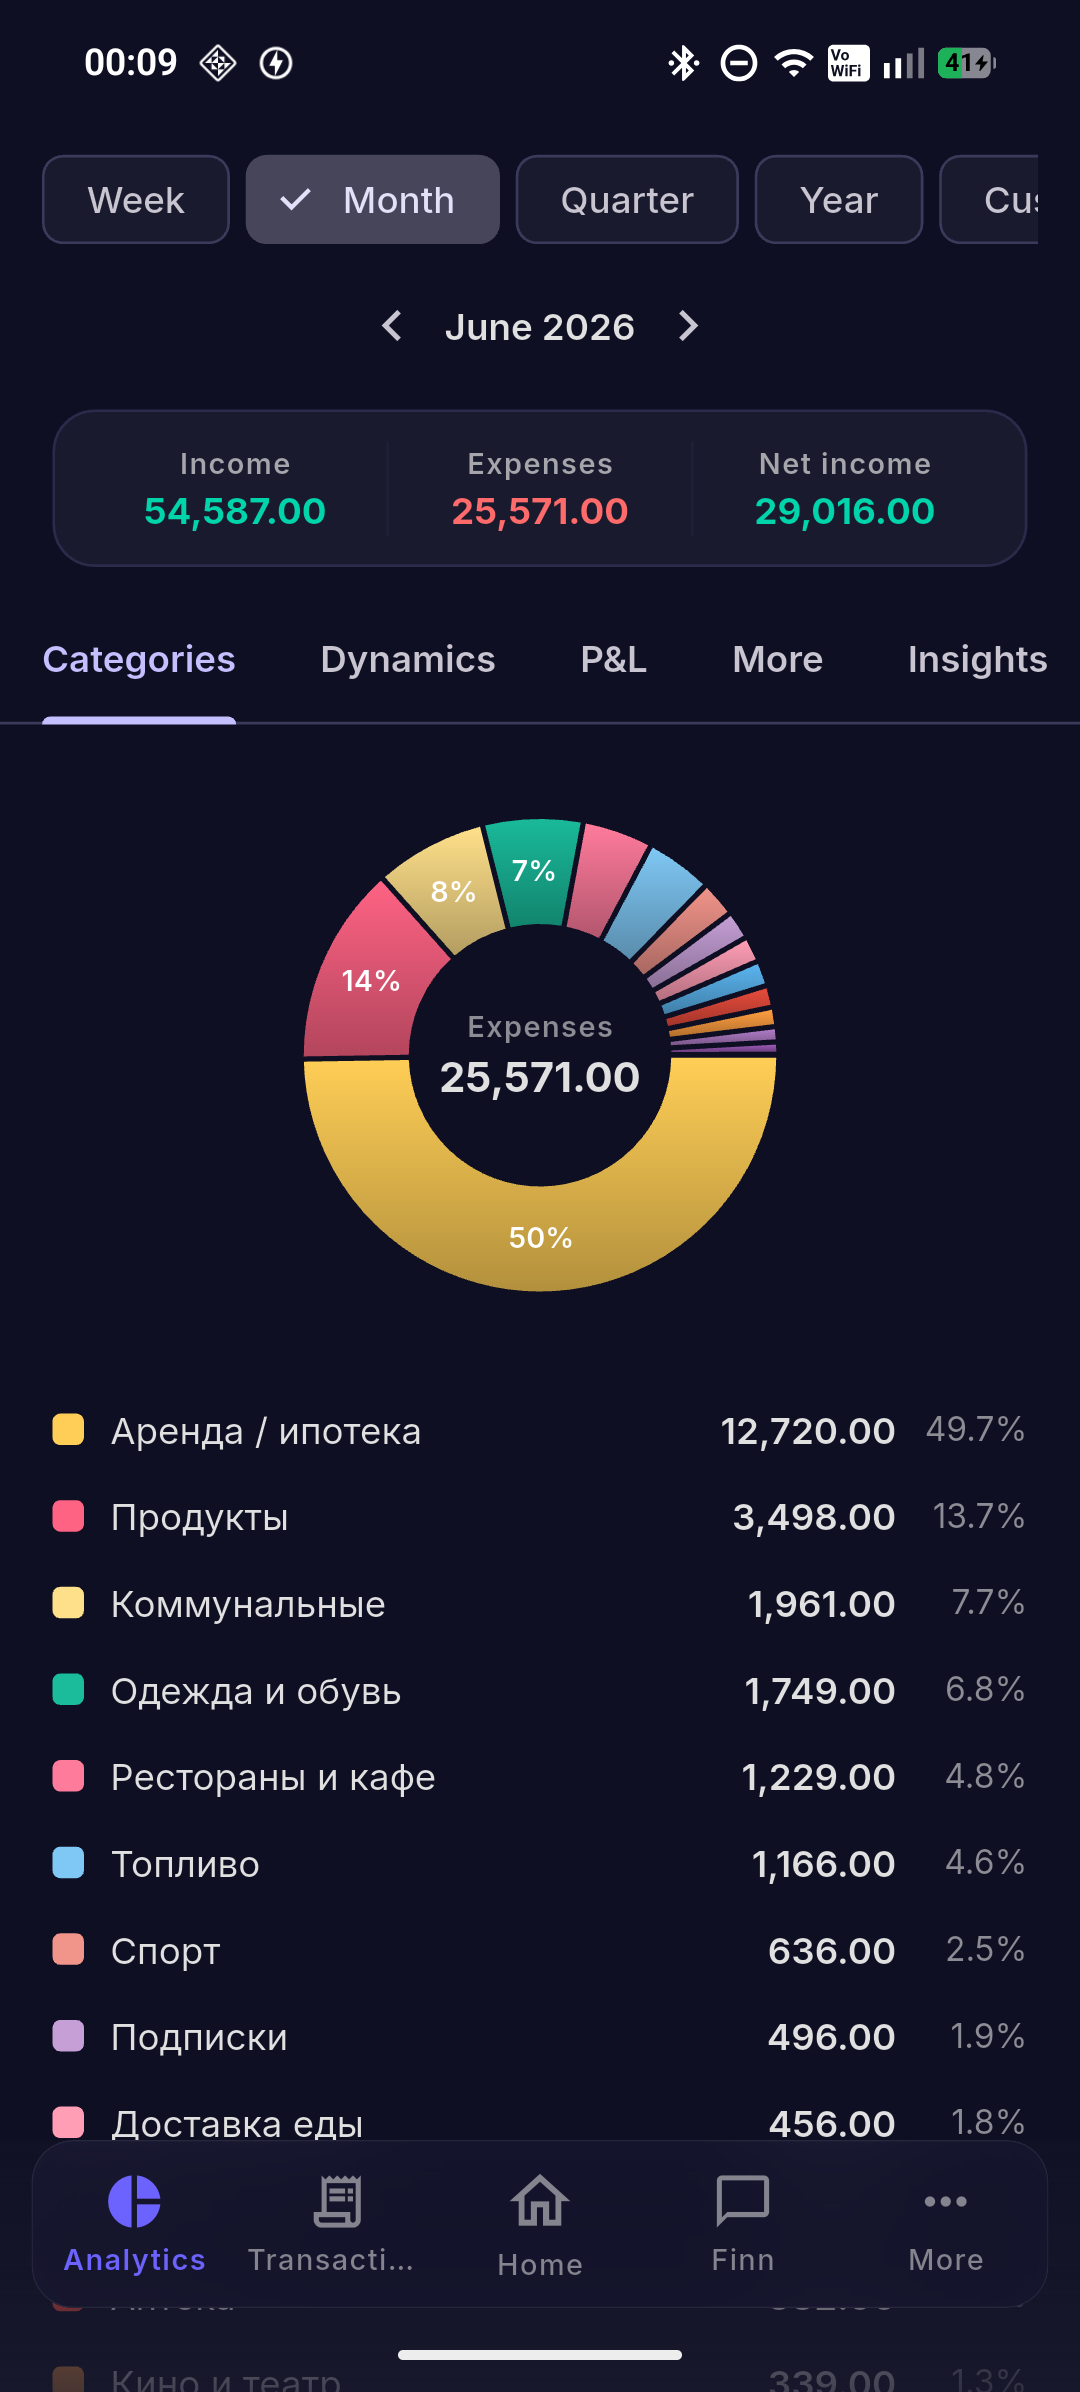
A category breakdown shows where every hryvnia goes.
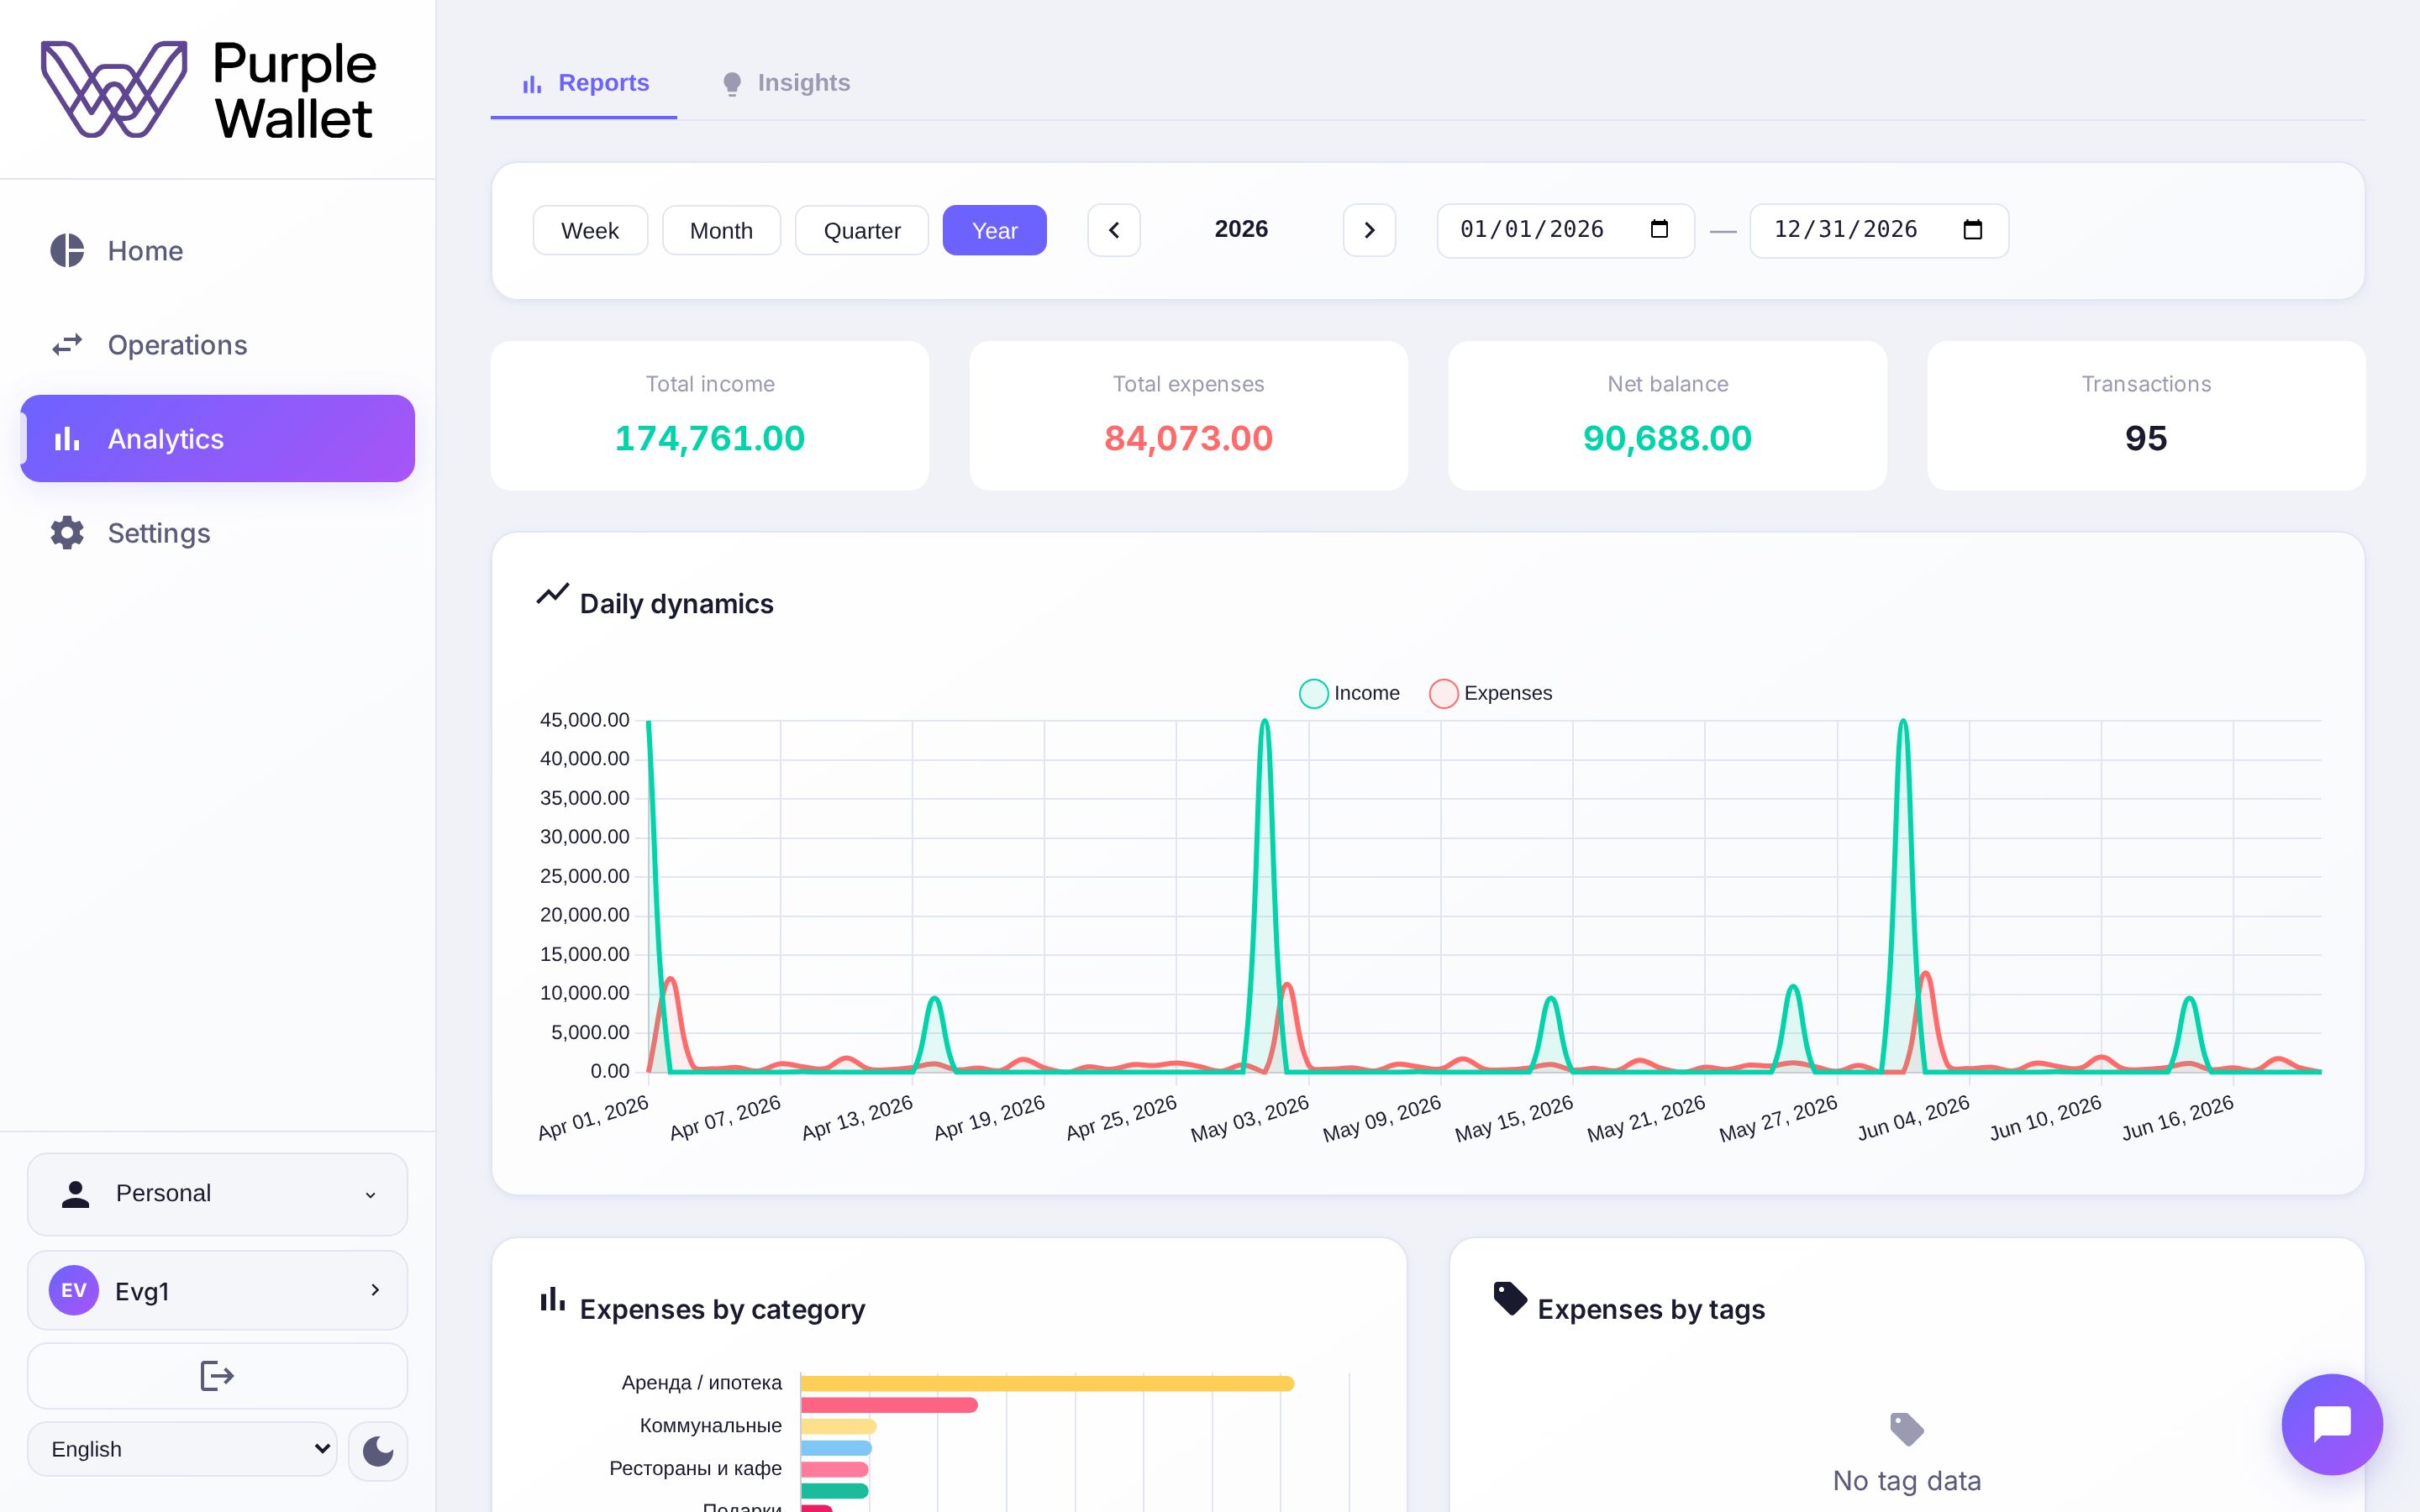
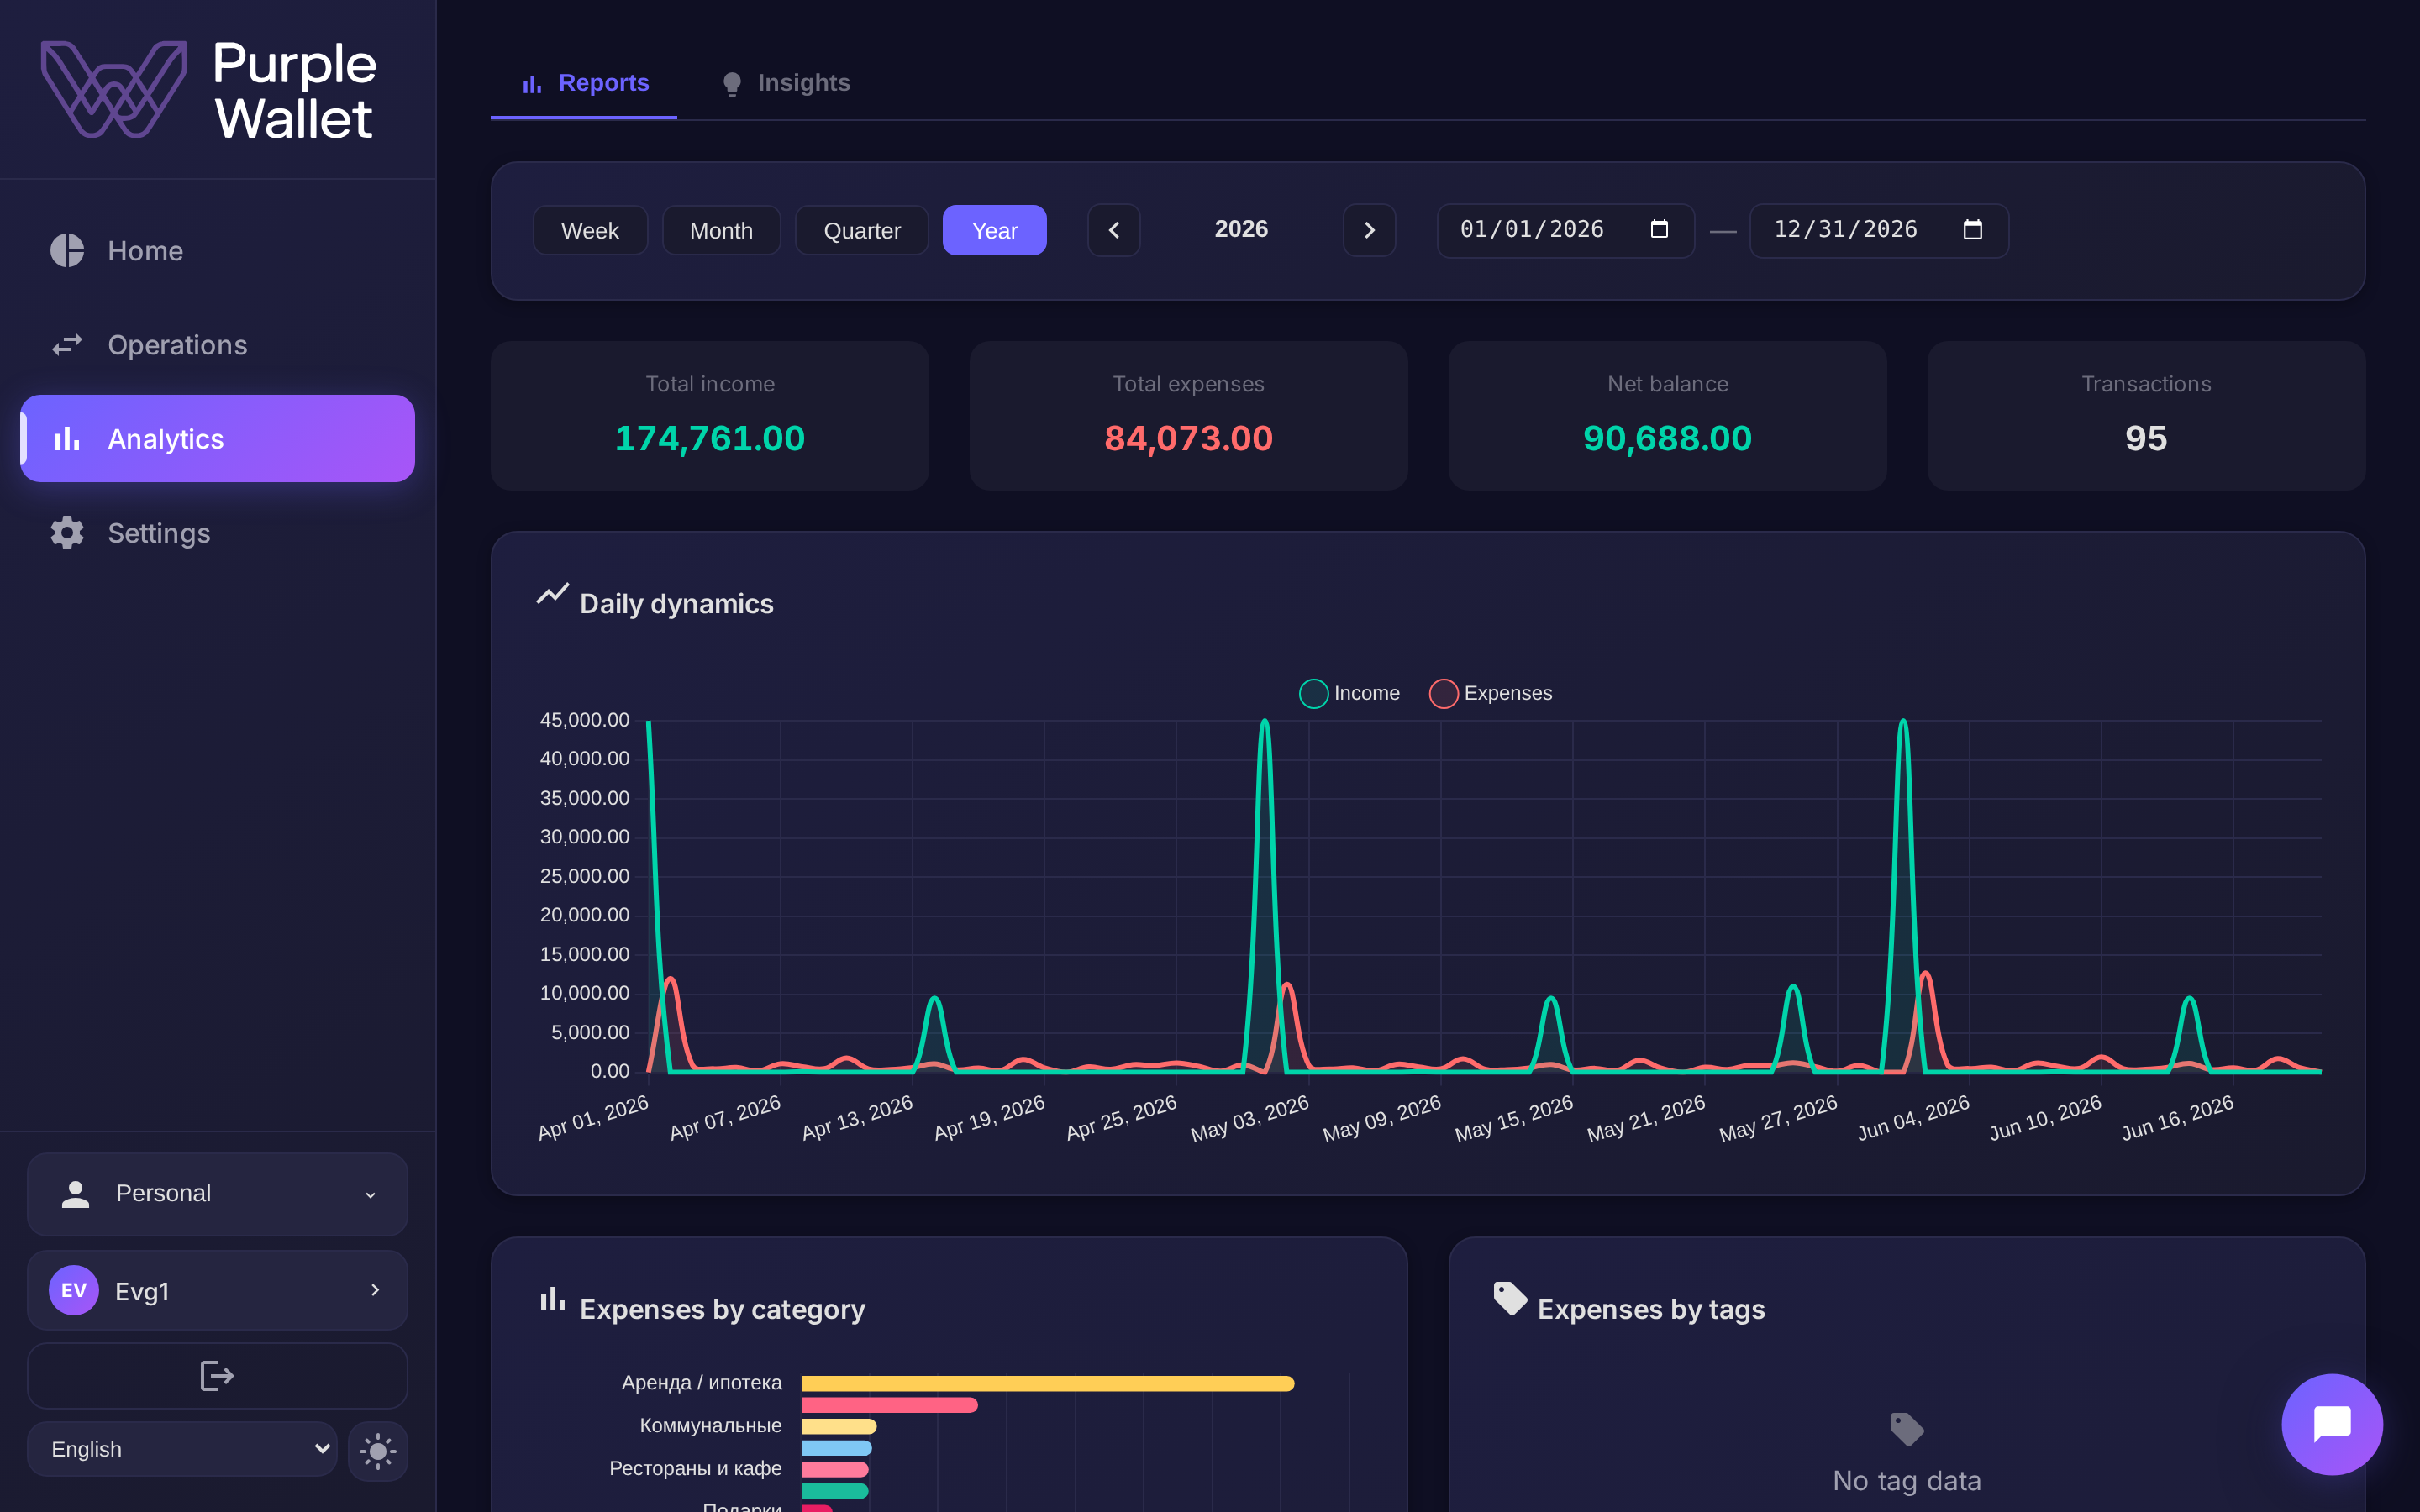
Reports, a breakdown by category and a balance forecast months ahead. A calm picture, with no spreadsheets or manual tallies.
Money slips away and it is unclear where.
A category breakdown shows where every hryvnia goes.
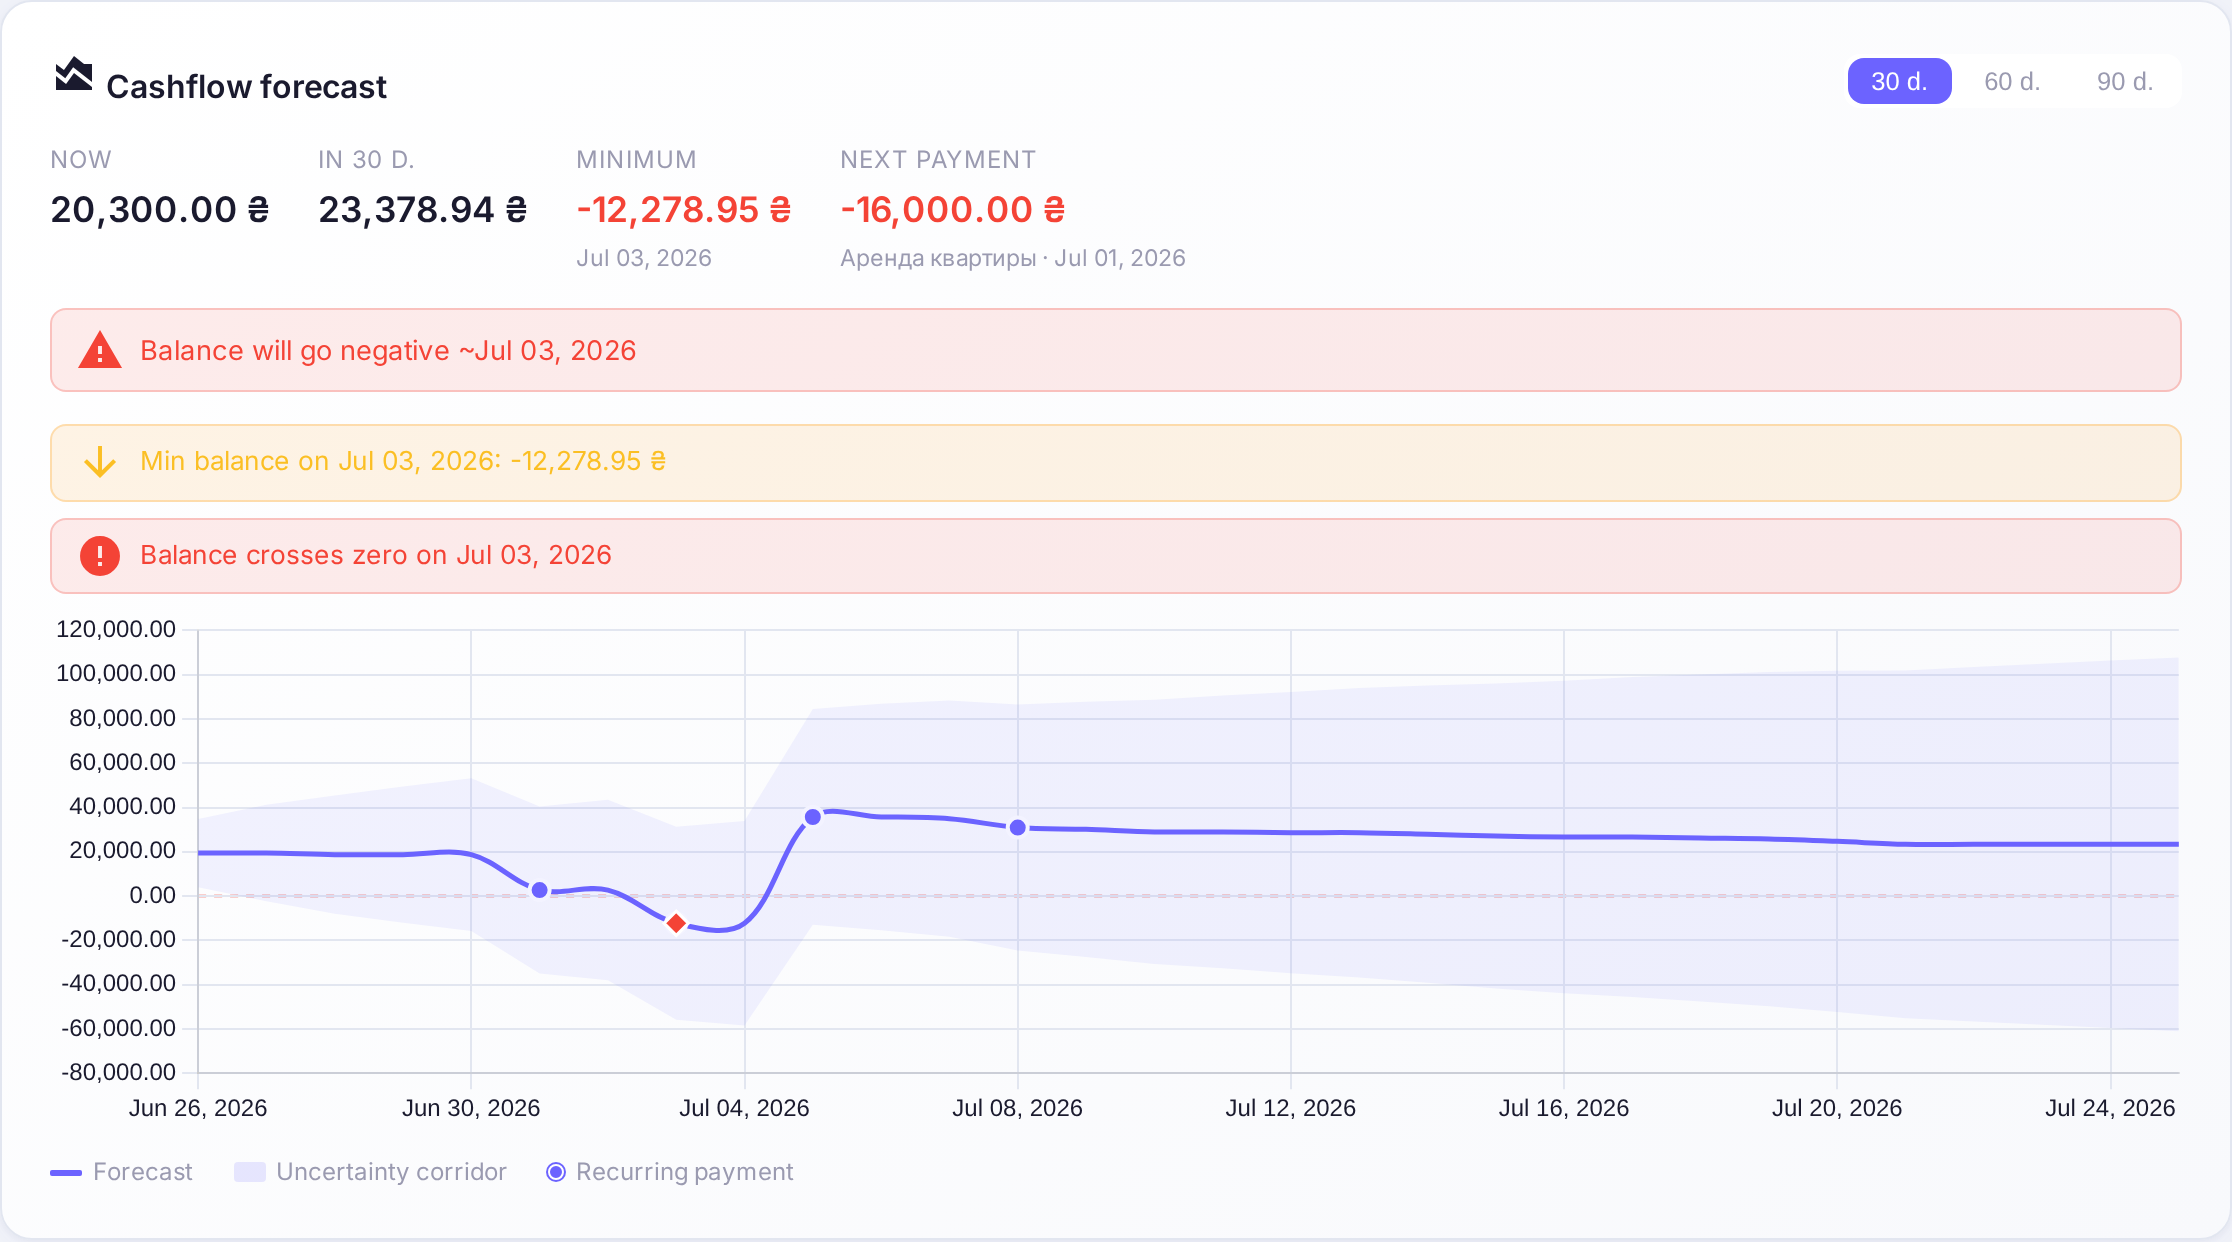
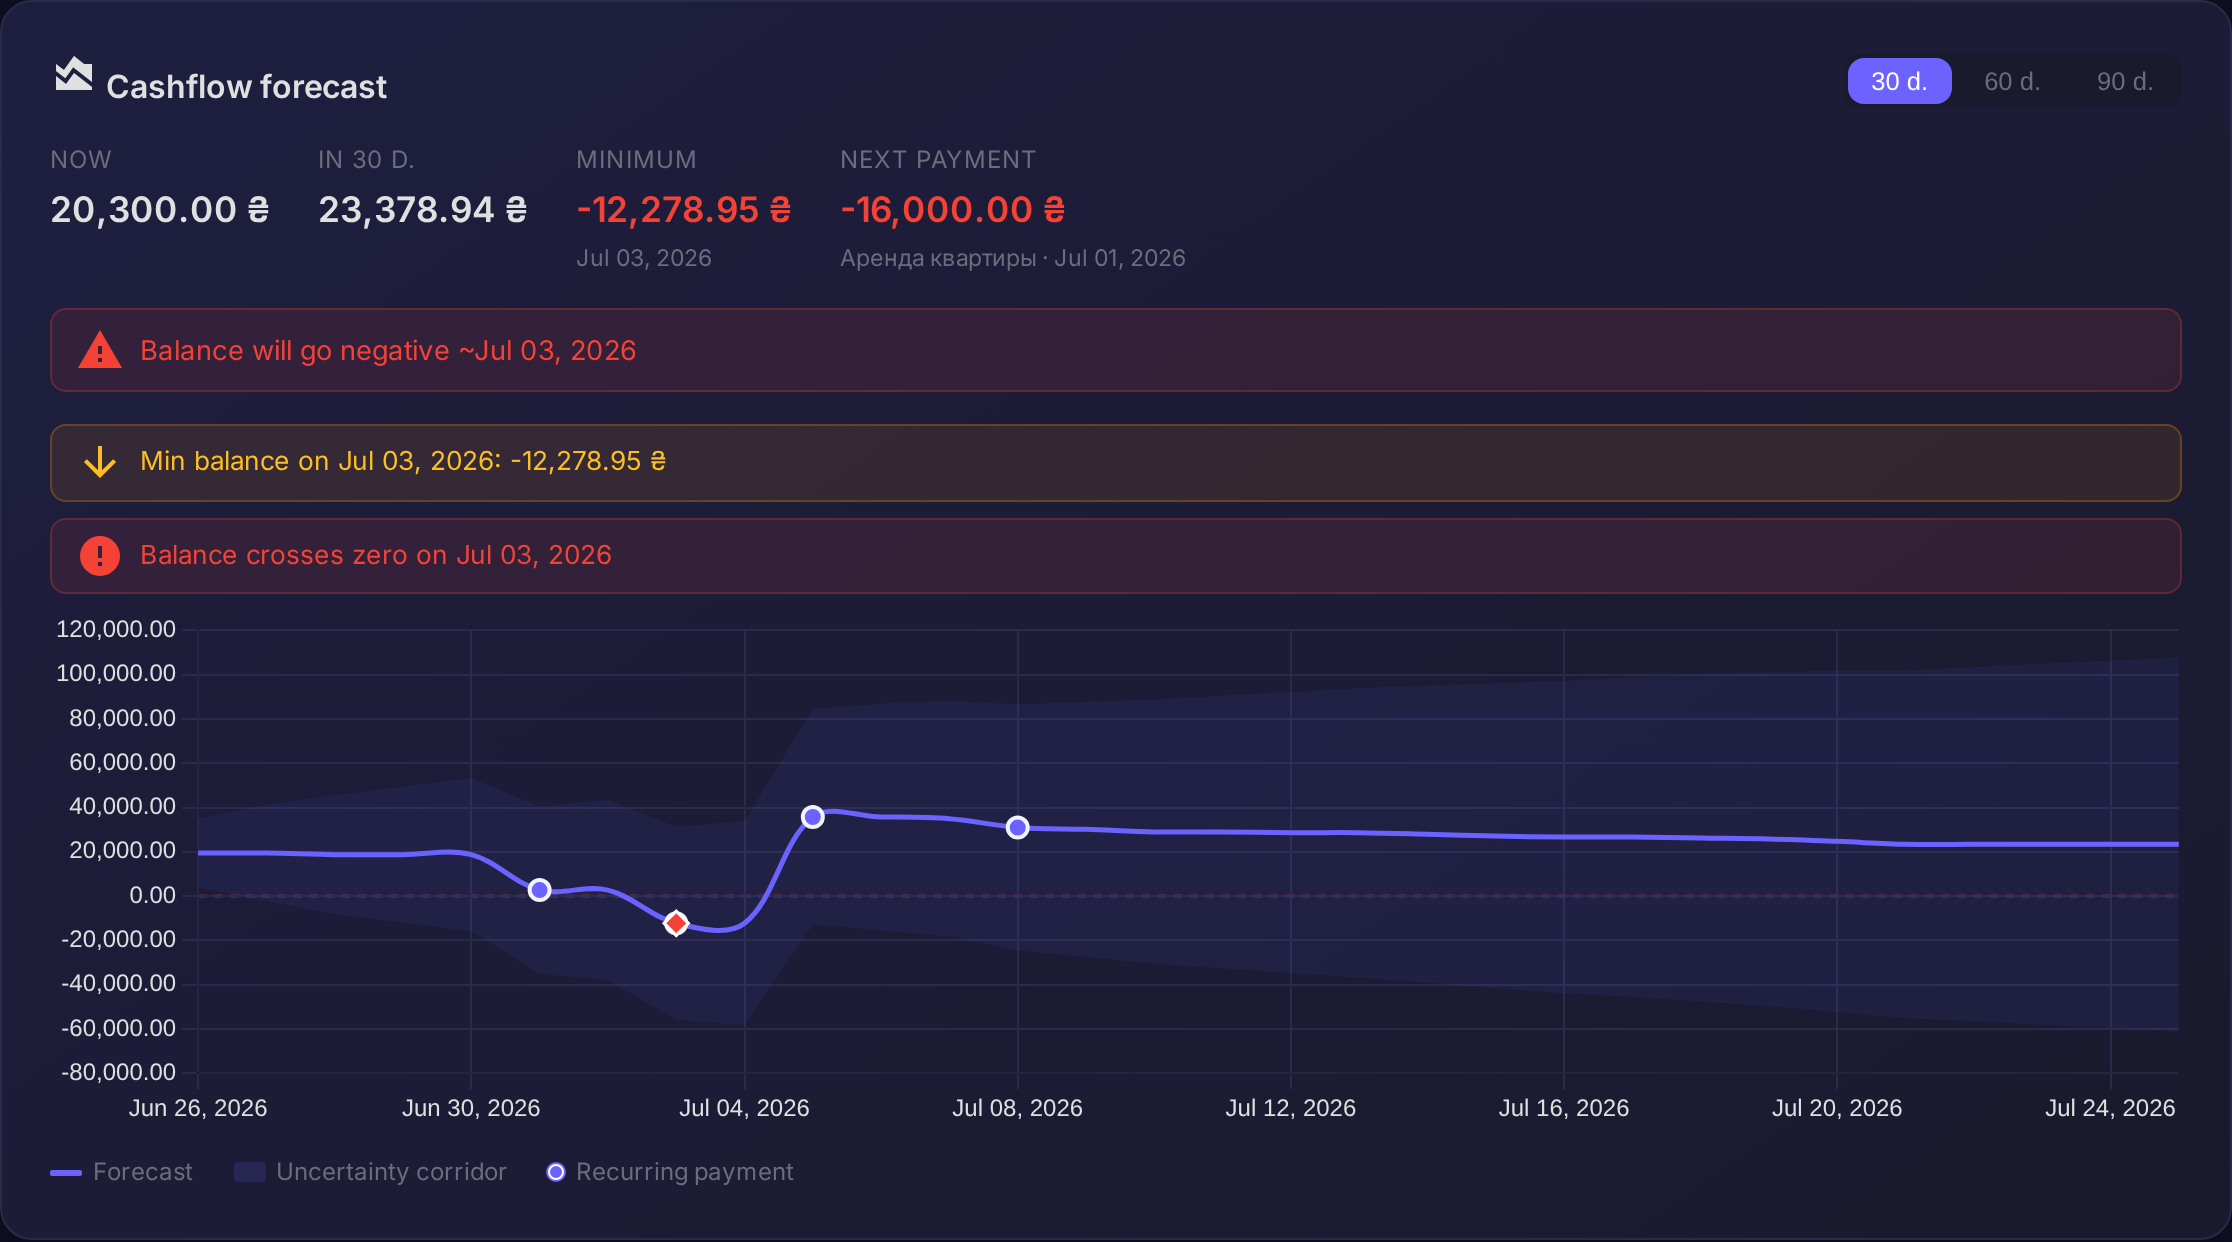
A large payment catches you off guard at month end.
The balance forecast warns about a cash gap in advance.
Reports have to be assembled by hand in spreadsheets.
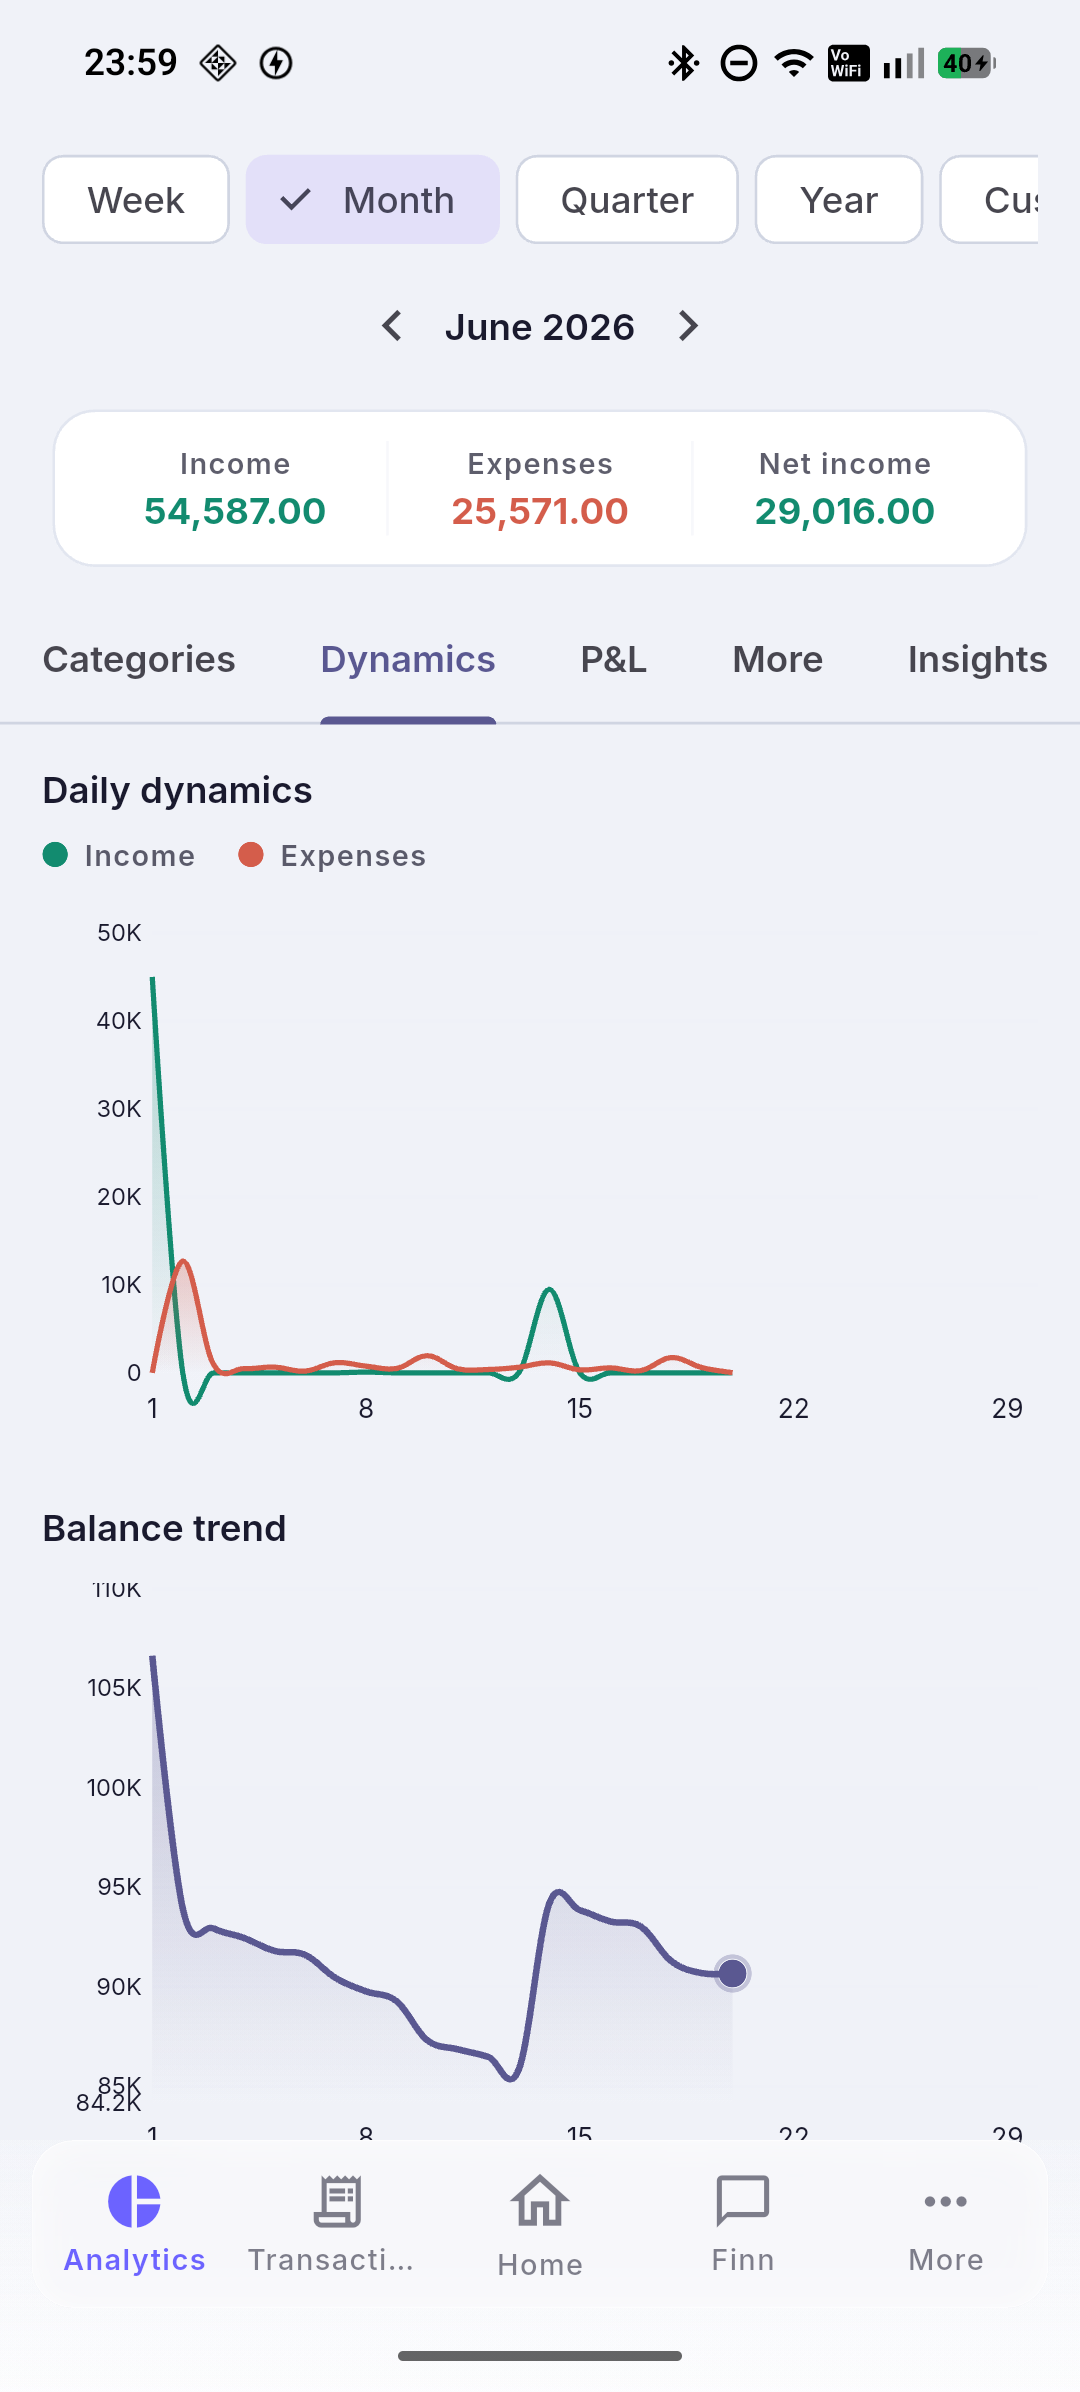
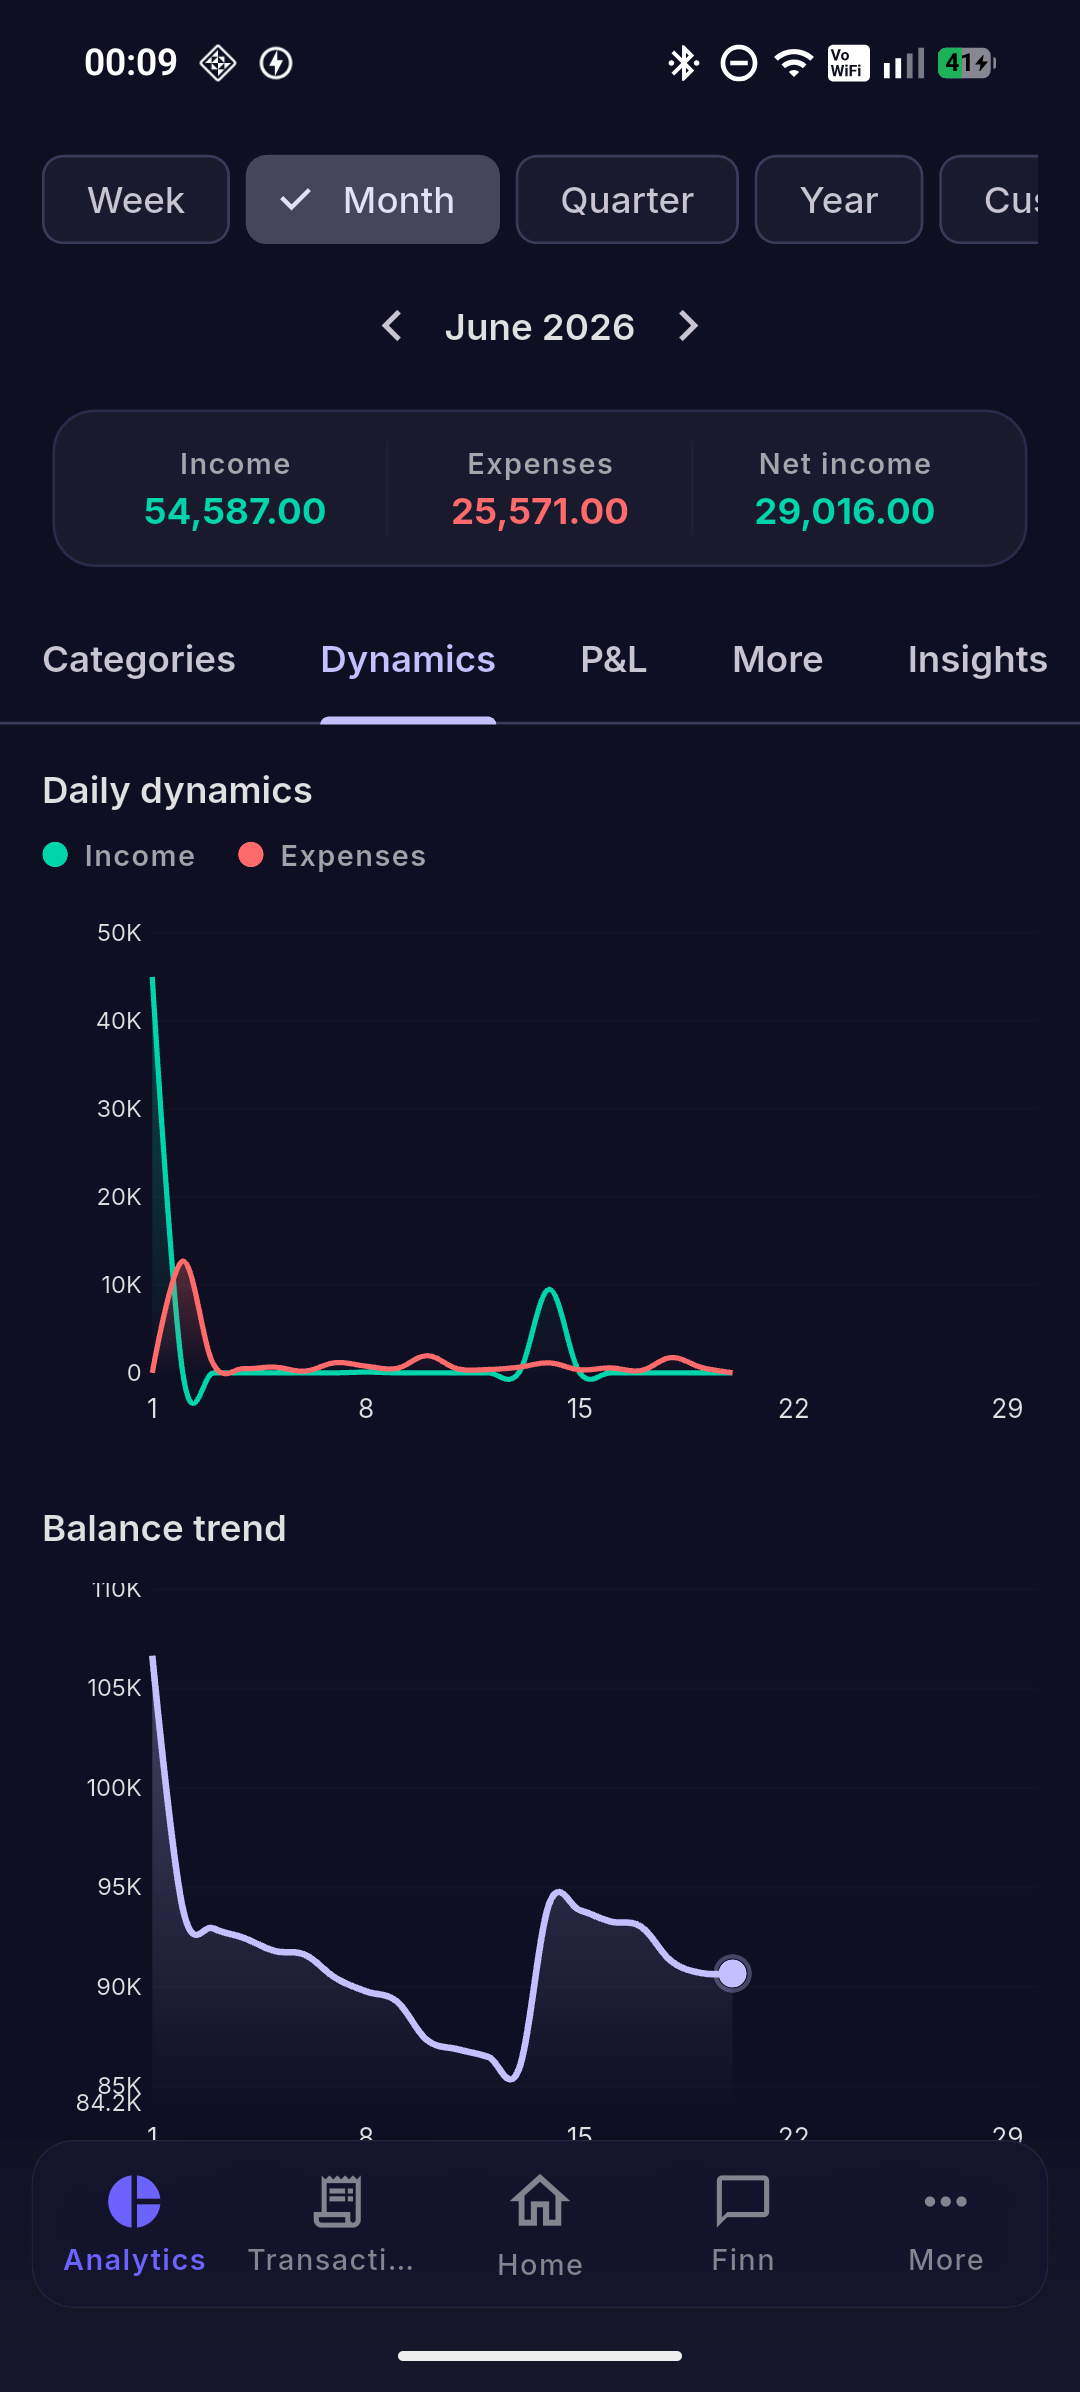
Charts and summaries build themselves — by week, month, quarter or year.
The balance line runs months ahead with an uncertainty corridor and recurring payments factored in. You see the moment money might run short — with time to plan.
Where money goes, at a glance. A donut chart and a list by share: rent, groceries, restaurants and the rest. You instantly see what weighs on the budget.
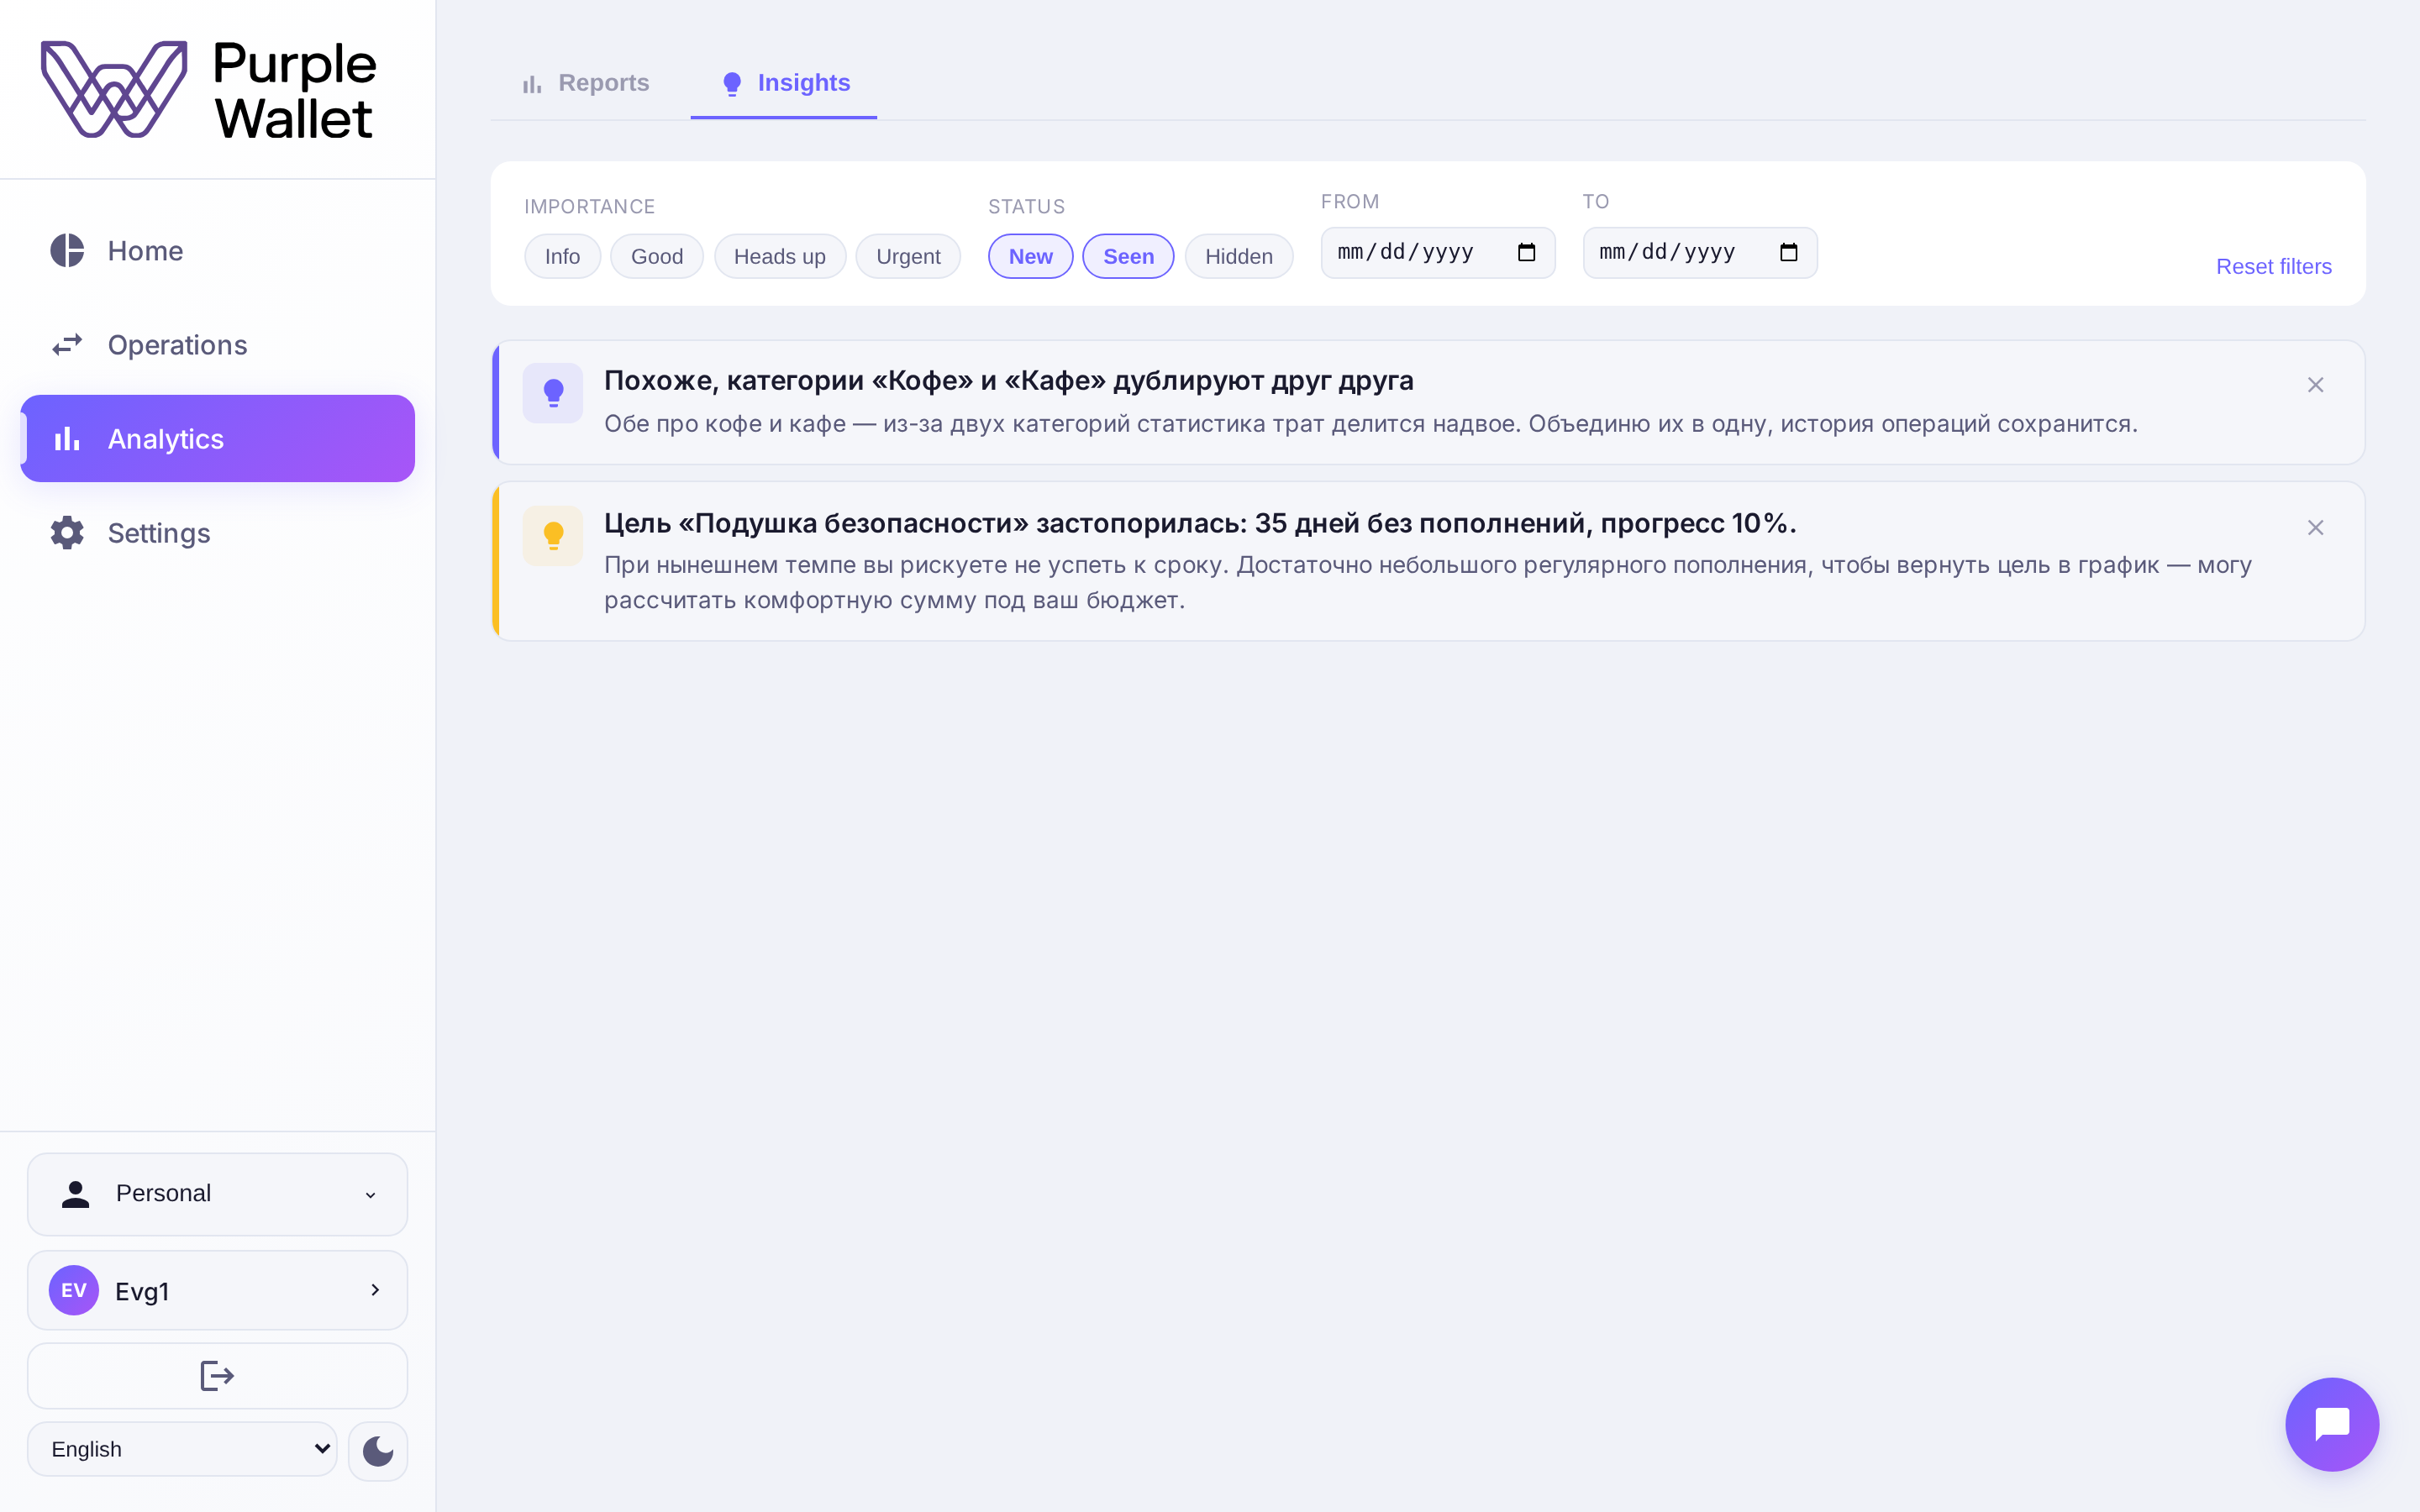
Finn notices what matters and writes first: a goal has stalled, spending is above usual, a large payment is coming. No noise — only what needs attention.

Daily dynamics and the balance trend over a period. You see the rhythm of income and spending — the peaks, the flat stretches, where the balance is heading.