Sometimes you want the accountant's view: everything that came in, everything that went out, and what's left. That's the profit and loss report.
The bottom line
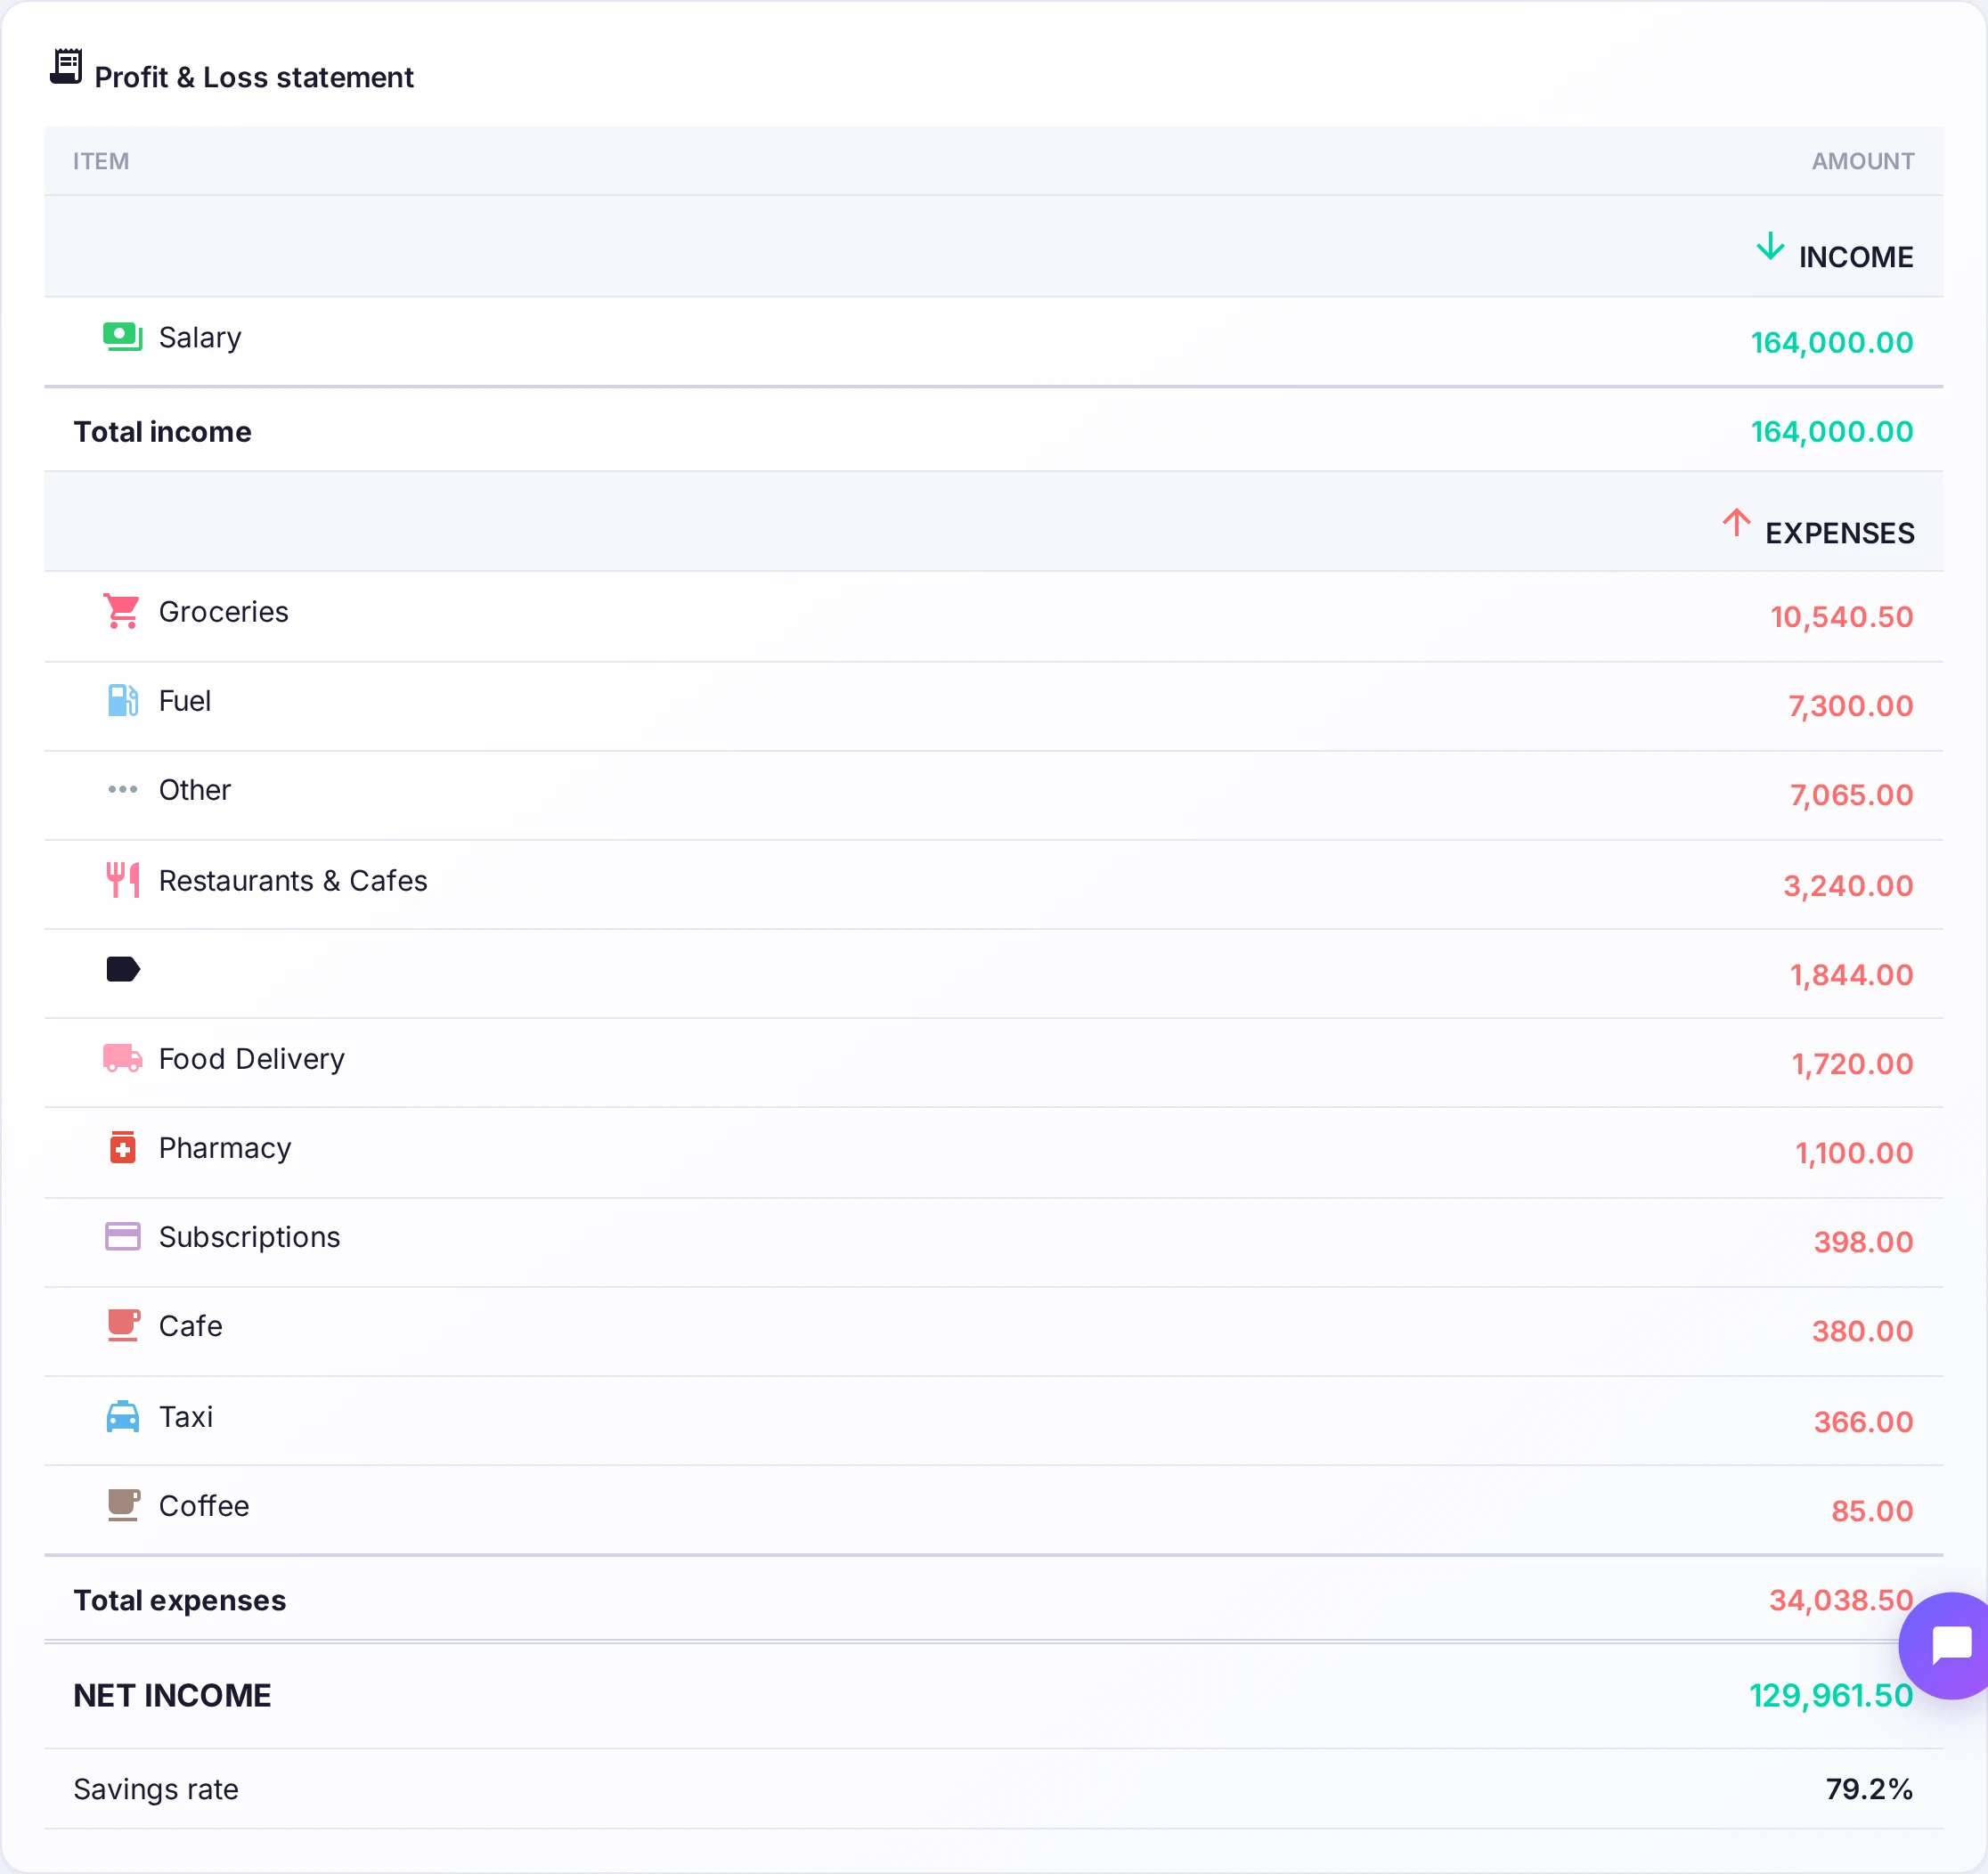
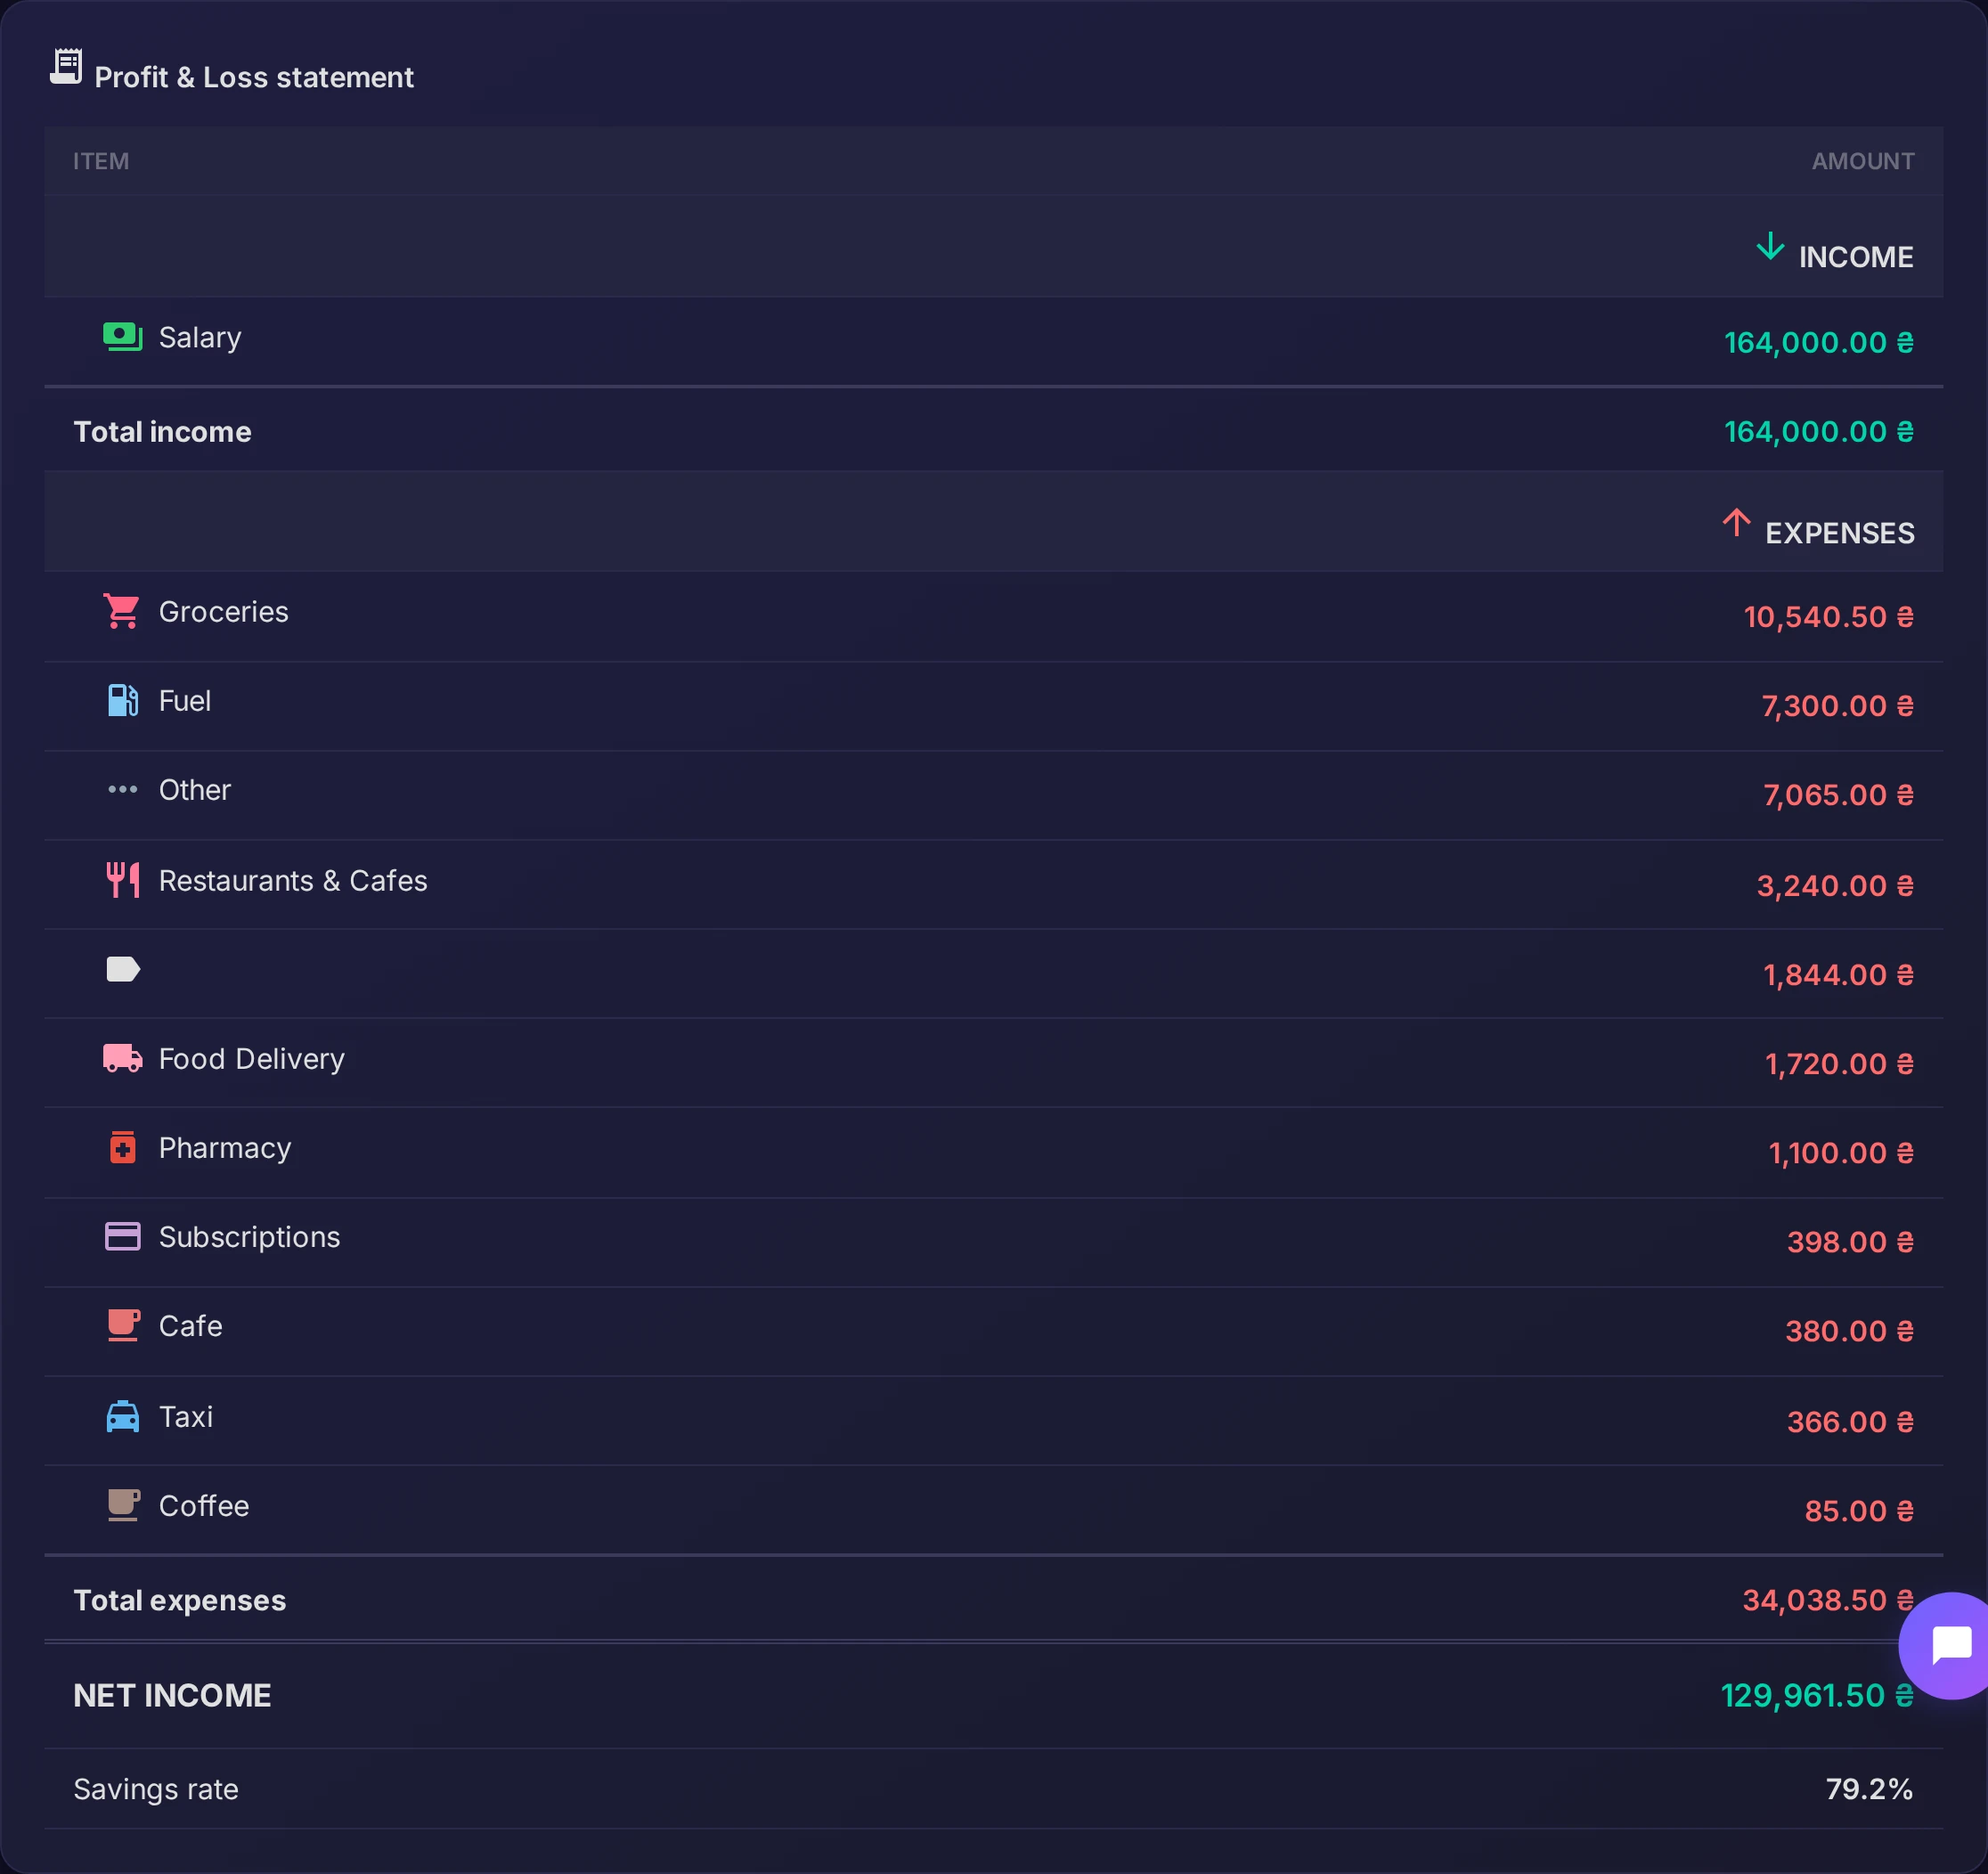
Income and expenses are laid out in a table down to a single net figure for the period. It reads like a small statement of your finances — what you earned, what you spent, and whether the month finished in the black or the red.
Compare with another period
A number alone doesn't say much until you have something to compare it to. The comparison puts this period next to the previous month or the same period last year, so you see the direction of travel — where spending grew, where income slipped — not just today's total.
Why it helps
Trends beat snapshots. A category that's a little higher every month is easy to miss in a single view but obvious the moment you set two periods side by side.